거대 제국 목록
이 문서에는 한국어로 번역되지 않은 내용이 담겨 있습니다. |
제국은 외부 영토와 다양한 소수의 다른 민족을 포함하는 것을 통해 국가 주권의 확장을 필요로 한다. 이 맥락에서 제국이라는 용어(반드시 황제가 지배하는 상태가 아닌)에 대한 정확한 정의는 없지만 일반적으로 정복으로 획득한 영토의 상당 부분과 자신들의 시간 기준에서는 특히 컸다고 생각되는 정치적 실체에 적용된다. 예를 들어 유럽에서 최초로 활동 범위를 넓혔던 포르투갈 제국, 이후의 스페인 제국과 대영 제국은 광대한 영토와 전세계의 재보(財寶)로 "해가 지지 않는 나라"라고 했다. 이 문서는 세계 역사에서 거대 제국의 목록을 다루는데 목록에는 없지만 아메리카 제국이라는 개념을 실체가 그러한 "제국"으로 간주할지 대해서는 논쟁을 안고 있기 때문에 결정하기 어렵다.
제국의 크기를 평가하는 데 사용할 수 있는 다양한 개념이 있다. 이러한 개념의 저마다에 대해서 유일한 지표는 대부분의 과거 제국을 들 수 있다. 또한 최선의 지표에 대한 역사학자들의 명확한 합의는 없다. 제국의 역사적 경계 또는 인구에 대한 더 명확한 자료가 보통 없기 때문이다. 따라서 여기에 소정의 값을 나타내는 유일한 지표가 아니라 정확한 순위를 결정한다는 등과 같이 해석되어야 한다.
측정 단위
특정 제국의 토지 면적의 계산은 논란의 여지가 있다. 대체적으로 이 목록은 매우 희박하거나 전혀 사람이 살고 있지 않았다는 명시적 영역을 탐색하고 발굴해서 모든 땅을 포함할 계획이다. 예를 들어 시베리아의 상당 부분이 러시아 제국의 크기는 아니지만 몽골 제국에 포함되어 있다. 몽골 제국의 북쪽 경계는 다소 불명확했지만 대부분의 위치에서 그것은 단순히 스텝 (지리)과 타이가 사이의 자연적인 경계였다. 당시 타이가와 툰드라의 대부분은 미개척지와 무인지대였고 몽골 제국은 그것들을 자신의 것으로 주장하지 않았다. 이 지역은 드문드문 러시아 제국이 거주하고 있었는데 그것이 명시적으로 17세기 즈음 러시아 제국이 19세기 후반이 되자 전적으로 조사되어 있었다고 주장했다. 마찬가지로 엘즈미어 섬과 같은 최북단의 캐나다의 섬은 대영 제국이 19세기 중반에 탐사되었다고 주장했다(사실상 본토는 적어도 그 훨씬 전에 드문드문 거주하고 있었다).
유럽의 식민지 제국


토지 면적과 인구에 따른 거대 제국
전후 관계에 대해서 지구의 총 토지 면적은 148,940,000 km2(57,500,000 sq mi)인 것에 주의를 요한다.
모든 제국의 최대 범위
| 제국 | 최대 면적(백만km2) | Max. land area (million mi2) | % of world land area | Era | Max. population ( million) | % of world population |
|---|---|---|---|---|---|---|
| British Empire | 33.7[1] | 13.0 | 22.6% | 000000001922-01-01-00001922[2] | 533.0 (in 1938)[3] | 20.0% (458 million out of 2.295 billion in 1938)[3] |
| Mongol Empire | 33.0[4][5][6][7] | 12.74 | 22.29% | 000000001279-01-01-00001279[8] | 110.0 (in the 13th century)[9] | 25.60% (110.0 million out of 429 million[10] in the 13th century) |
| Russian Empire | 22.8 | 8.80 | 15.31% | 000000001866-01-01-00001866 | 176.4 (in 1913) | 9.80% (176.4 million out of 1.791 billion[11] in 1913) |
| Spanish Empire | 19.4[12][13][14] | 7.49 | 13.03% | 000000001783-01-01-00001783–000000001801-01-01-00001801 | 68.2 (in the 17th century) | 12.3% (68.2 million out of 556 million[11] in the 17th century) |
| Umayyad Caliphate | 15.0[15] | 5.79 | 10.07% | 000000000661-01-01-0000661–000000000750-01-01-0000750 | 62.0 (in the 7th century) | 28.80% (62.0 million out of 208 million in the 7th century) |
| Yuan dynasty | 14.0 | 5.41 | 9.40% | 000000001310-01-01-00001310[16] | 59.8 in 1291.[17][18] | 17.10% (59.8 million out of 350 million in 1290) |
| Qing dynasty | 13.1 | 5.05 | 8.79% | 000000001760-01-01-00001760[8][16] | 432.2 in 1851.[19] | 36.60% (381.0 million out of 1.041 billion in 1820)[11] |
| Second French colonial empire | 12.3 | 4.76 | 8.27% | 000000001938-01-01-00001938[20] | 112.9 in 1938 | 5.10% (112.9 million out of 2.295 billion in 1938) |
| Abbasid Caliphate | 11.1 | 4.29 | 7.45% | 000000000750-01-01-0000750–000000001258-01-01-00001258[16] | 44.0 (in 850) | 20.00% (50.0 million out of 250 million in 850)[11] |
| Portuguese Empire | 10.4 | 4.02 | 6.98% | 000000001815-01-01-00001815[20] | — | — |
| Achaemenid Empire | 8.5 | 3.28 | 5.36% | -999999999500-01-01-0000500 BC[21] | 50.0 (in 480 BC)[22] | 44.48% (50 million out of 112.4 million in 480 BC)[23] |
| Empire of Brazil | 8.5 | 3.28 | 5.71% | 000000001880-01-01-00001880 | 14 (in 1889)[24] | — |
| Rashidun Caliphate | 8.4 | 3.24 | 6.04% | 000000000654-01-01-0000654[16][25] | 40.3 | 19.10% (40.3 million out of 210 million in 7th century) |
| First French colonial empire | 8.1 | 3.12 | 5.44% | 000000001754-01-01-00001754 | 30 (in 1754)[26] | — |
| Empire of Japan | 7.4 | 2.86 | 4.97% | 000000001942-01-01-00001942[20] | 134.8 in 1938 | 5.90% (134.8 million out of 2.295 billion[11] in 1938) |
| Sasanian Empire | 6.6 | 2.55 | 4.44% | 000000000621-01-01-0000621[8] | 25.0 (in the 7th century AD) | 12.00% (25.0 million out of 210 million[27] in the 7th century AD) |
| Ming dynasty | 6.5 | 2.51 | 4.36% | 000000001450-01-01-00001450[8][16] | 110.0 in 1600.[28][29] | 19.57% (110.0 million out of 556.2 million in 1600)[11] |
| Han dynasty | 6.5[30] | 2.51 | 4.36% | 000000000100-01-01-0000100[31] | 58.0 (in 2 AD)[17][32] | 19.3% (58 million out of 300 million[11] in 2 AD) |
| Göktürk Khaganate | 6.0 | 2.32 | 4.03% | 000000000557-01-01-0000557[8][31] | 6.0 | 2.0% |
| Golden Horde Khanate | 6.0 | 2.32 | 4.03% | 000000001310-01-01-00001310[8][16] | — | — |
| Tang dynasty | 5.5[33] | 2.01 | 3.75% | 000000000715-01-01-0000715[8][16] | 50.0 (in the 8th century) | 24.0% (50.0 million out of 220 million in the 8th century AD)[21] |
| Macedonian Empire | 5.2 | 2.01 | 3.49% | -999999999677-01-01-0000323 BC[8][34] | 50 (in the 4th century BC) | 30.30% (50.0 million out of 165 million[11] in the 4th century BC) |
| Ottoman Empire | 5.2 | 2.00 | 3.49% | 000000001683-01-01-00001683[8][16] | 35.3 in 1856 | 7.10% (39.0 million out of 556 million[11] in 1683) |
| Roman Empire | 5.0[8][35] | 1.93 | 3.36% | 000000000117-01-01-0000117 | 70.0 (in the 2nd century AD)[36][37][38] | 35.00% (70 million out of 200 million in 150 AD)[39] [40] |
| Maurya Empire | 5.0 | 1.93 | 3.36% | -999999999735-01-01-0000265 BC[8] | 50–60 million in the 2nd century BC | 33%–40% (50–60 million out of 150 million in the 2nd century BC.[41][42] |
| Mughal Empire | 5.0 | 1.93 | 3.36% | 000000001707-01-01-00001707[8][16][43] | 150.0 (in 1700) | 24.8% (150.0 million out of 610 million[44]) |
| Northern Yuan dynasty | 5.0 | 1.93 | 3.36% | 000000001550-01-01-00001550[16] | — | — |
| First Mexican Empire | 4.9 | 1.89 | 3.29% | 000000001822-01-01-00001822[citation needed] | — | — |
| Xin dynasty | 4.70 | 1.82 | 3.16% | 000000000010-01-01-000010[31] | — | — |
| Pala Empire | 4.6[citation needed] | 1.78 | 3.09% | 000000000850-01-01-0000850 | 60.0 (in the 3rd Century) | 24.00%[not in citation given] (60.0 million out of 250 million in 850)[11][dead link] |
| Tibetan Empire | 4.6 | 1.78 | 3.09% | 000000000800-01-01-0000800[16][45] | 25.0 | 8.333% |
| Afsharid dynasty | 4.5 | 1.73 | 3.02 | 000000001746-01-01-00001746[citation needed] | 60 (in 1740s) | — |
| Timurid Empire | 4.4 | 1.70 | 2.95% | 000000001405-01-01-00001405[8][16] | 50.00 (in the 15th Century) | 11.36% (50.0 million out of 440 million in 1400)[11] |
| Fatimid Caliphate | 4.1 | 1.58 | 2.75% | 000000000969-01-01-0000969[8][16] | — | — |
| Xiongnu Empire | 4.03 | 1.56 | 2.71% | -999999999824-01-01-0000176 BC[46] | — | — |
| Hephthalite Empire | 4.0 | 1.54 | 2.69% | 000000000490-01-01-0000490[31] | — | — |
| Hunnic Empire | 4.0 | 1.54 | 2.69% | 000000000441-01-01-0000441[31] | — | — |
| Eastern Turkic Khaganate | 4.0 | 1.54 | 2.69% | 000000000624-01-01-0000624[31] | — | — |
| Rouran Khaganate Juan-juan | 4.0 | 1.54 | 2.69% | 000000000405-01-01-0000405[8][31] | — | — |
| Western Turkic Khaganate | 4.0 | 1.54 | 2.69% | 000000000630-01-01-0000630[31] | — | — |
| Great Seljuq Empire | 3.9 | 1.51 | 2.62% | 000000001080-01-01-00001080[8][16] | — | — |
| Italian Empire | 3.8 | 1.47 | 2.55% | 000000001940-01-01-00001940[citation needed] | 51.9 (in 1938) | 2.30% (51.9 million out of 2.295 billion in 1938) |
| Kushan Empire | 3.8 | 1.47 | 2.55% | 000000000200-01-01-0000200[31] | 42.37 (in the 2nd Century) | 19.00% (42.37 million out of 223 million in 140)[11] |
| Ilkhanate | 3.75 | 1.45 | 2.52% | 000000001310-01-01-00001310[8][16] | — | — |
| Dutch Empire | 3.7 | 1.43 | 2.48% | 000000001940-01-01-00001940[citation needed] | 60.0 (in 1940) | 3.50% (60.0 million out of 1.700 billion in 1907) |
| Chola Empire | 3.6 | 1.39 | 2.42% | 000000001050-01-01-00001050[47][48] | — | — |
| Khwarazmian Empire | 3.6 | 1.39 | 2.42% | 000000001218-01-01-00001218[16] | 20.0 in 1200 | 5.00% |
| Greater German Reich | 3.6 | 1.39 | 2.42% | 000000001942-01-01-00001942[49] | 70.8 (in 1942) | — |
| Byzantine Empire | 3.5 | 1.35 | 3.00% | 000000000555-01-01-0000555[31] | 30.0 (in 555–600) | 10.00% (30.0 million out of 300 million in 600)[11] |
| German Empire | 3.5 | 1.35 | 2.35% | 000000001914-01-01-00001914[citation needed] | 64.9 in 1914 | 3.70% (64.9 million out of 1.753 billion in 1910) |
| Chagatai Khanate | 3.5 | 1.35 | 2.35% | 000000001310-01-01-00001310 or 000000001350-01-01-00001350[8][16] | — | — |
| Gupta Empire | 3.5 | 1.35 | 2.35% | 000000000400-01-01-0000400[8] | — | 26.36% (58.0 million out of 220 million in 400 AD)[3] |
| Northern Song Dynasty | 3.5 | 1.35 | 2.35% | 000000001100-01-01-00001100[8][16] | 123.0 in 1103[17][50] | 22.00% (59.0 million out of 268 million in 1000)[11] |
| Safavid dynasty | 3.5 | 1.35 | 2.35% | 000000001512-01-01-00001512[citation needed] | — | — |
| Khanate of Bukhara | 3.5 | 1.35 | 2.35% | 000000001510-01-01-00001510[16] | — | — |
| Western Jin dynasty | 3.5 | 1.35 | 2.35% | 000000000300-01-01-0000300[31] | 48.0 in 1195.[17][51] | — |
| Phoenician Empire | 3.4 | 1.32 | 2.31% | -999999999200-01-01-0000800 BC[16] | — | — |
| Ghaznavid Empire, Afghanistan | 3.4 | 1.31 | 2.28% | 000000001029-01-01-00001029[8][16] | — | — |
| Almoravid dynasty, Morocco | 3.3 | 1.27 | 2.22% | 000000001147-01-01-00001147[16] | — | — |
| Ghurids Sultanate | 3.2 | 1.24 | 2.15% | 000000001200-01-01-00001200[16] | — | — |
| Tughlaq dynasty | 3.2 | 1.24 | 2.15% | 000000001320-01-01-00001320[16] | — | 18.91% (70.0 million out of 370 million in 1330)[11] |
| Karkota Dynasty of Kashmir | 3.09[citation needed] | 1.19 | 2.07% | 000000000750-01-01-0000750 | — | — |
| Median Empire | 3.1 | 1.08 | 1.88% | -999999999415-01-01-0000585 BC[8][34] | — | — |
| Parthian Empire | 3.1 | 1.08 | 1.88% | 000000000001-01-01-00001[8][34] | — | — |
| Sui Dynasty | 3.1 | 1.20 | 2.08% | 000000000610-01-01-0000610[16] | 53.0 in 606[17][52] | — |
| Uyghur Khaganate | 3.1 | 1.20 | 2.08% | 000000000800-01-01-0000800[8][16] | — | — |
| Danish Colonial Empire | 3.0 | 1.16 | 2.01% | 000000001800-01-01-00001800[citation needed] | — | — |
| Grand Duchy of Moscow | 3.0 | 1.16 | 2.01% | 000000001505-01-01-00001505[citation needed] | — | — |
| Kalmar Union | 3.0 | 1.16 | 2.01% | 000000001397-01-01-00001397[citation needed] | — | — |
| Kara-Khanid Khanate | 3.0 | 1.16 | 2.01% | 000000001025-01-01-00001025[16] | — | — |
| Khazar Khanate | 3.0 | 1.16 | 2.01% | 000000000850-01-01-0000850[8] | — | — |
| Qajar dynasty | 3.0 | 1.16 | 2.01% | 000000001796-01-01-00001796[citation needed] | — | — |
| Seleucid Empire | 3.0 | 1.15 | 2.62% | -999999999699-01-01-0000301 BC[8][34] | — | — |
| Samanid dynasty | 2.85 | 1.10 | 1.91% | 000000000928-01-01-0000928[8][16] | — | — |
| Eastern Jin dynasty | 2.8 | 1.08 | 1.88% | 000000000347-01-01-0000347[31] | — | — |
| Liu Song dynasty | 2.8 | 1.08 | 1.88% | 000000000420-01-01-0000420[31] | — | — |
| Maratha Empire | 2.8 | 0.97 | 1.68% | 000000001760-01-01-00001760[8] | — | — |
| Qin dynasty | 2.8 | 1.08 | 1.88% | -999999999794-01-01-0000206 BC[31] | — | — |
| Khilji dynasty | 2.7 | 1.04 | 1.81% | 000000001312-01-01-00001312 or 000000001320-01-01-00001320[8][16] | — | — |
| Majapahit Empire | 2.7 | 1.04 | 1.81% | 000000001389-01-01-00001389[31] | — | — |
| Liao dynasty | 2.6 | 1.00 | 1.75% | 000000000947-01-01-0000947[8][16] | — | — |
| Belgian Empire | 2.5 | 0.97 | 1.68% | 000000001914-01-01-00001914[citation needed] | — | — |
| Greco-Bactrian Kingdom | 2.5 | 0.97 | 1.68% | 000000000184-01-01-0000184[31] | — | — |
| Hotaki Empire, Afghanistan | 2.5 | 0.97 | 1.68% | 000000001722-01-01-00001722[citation needed] | — | — |
| Jurchen Jin dynasty | 2.3 | 0.89 | 1.54% | 000000001126-01-01-00001126[8][16] | — | — |
| Qara Khitai (Western Liao) | 2.5 | 0.97 | 1.68% | 000000001210-01-01-00001210[8] | — | — |
| Later Zhao dynasty | 2.5 | 0.97 | 1.68% | 000000000329-01-01-0000329[31] | — | — |
| Indo-Greek Kingdom | 2.5 | 0.97 | 1.68% | -999999999850-01-01-0000150 BC[31] | — | — |
| Southern Qi dynasty | 2.3 | 0.89 | 1.54% | 000000000502-01-01-0000502[31] | — | — |
| Southern Song dynasty | 2.1 | 0.81 | 1.41% | 000000001127-01-01-00001127[16] | 73.0 in 1193.[17][53] | — |
| Bahriyya Mamluks | 2.1 | 0.81 | 1.41% | 000000001300-01-01-00001300[16] | — | — |
| Burjiyya Mamluks | 2.1 | 0.81 | 1.41% | 000000001400-01-01-00001400[8] | — | — |
| First French Empire | 2.1 | 0.81 | 1.41% | 000000001813-01-01-00001813[16] | — | — |
| Kievan Rus | 2.1 | 0.81 | 1.41% | 000000000882-01-01-0000882[8][16] | — | — |
| Ayyubid Caliphate | 2.0 | 0.77 | 1.34% | 000000001190-01-01-00001190[8] | — | — |
| Durrani Empire, Afghanistan | 2.0 | 0.77 | 1.34% | 000000001757-01-01-00001757[54] | — | — |
| Wei dynasty | 2.0 | 0.77 | 1.34% | 000000000263-01-01-0000263[31] | — | — |
| Earlier Zhao dynasty | 2.0 | 0.77 | 1.34% | 000000000316-01-01-0000316[31] | 64 in 156[17][55] | — |
| Former Qin dynasty | 2.0 | 0.77 | 1.34% | 000000000376-01-01-0000376[31] | — | — |
| Western Roman Empire | 2.0 | 0.77 | 1.34% | 000000000395-01-01-0000395[31] | — | — |
| Northern Wei dynasty | 2.0 | 0.77 | 1.34% | 000000000450-01-01-0000450[31] | — | — |
| Saffarid dynasty, Iran | 2.0 | 0.77 | 1.34% | 000000000900-01-01-0000900[citation needed] | — | — |
| Almohad Caliphate | 2.0 | 0.77 | 1.34% | 000000001200-01-01-00001200[8] | — | — |
| Satavahana Empire | 2.0 | 0.77 | 1.34% | 000000000090-01-01-000090[31] | — | — |
| Inca Empire | 2.0 | 0.77 | 1.34% | 000000001527-01-01-00001527[8][16] | — | — |
| Second Mexican Empire | 2.0 | 0.77 | 1.34% | 000000001864-01-01-00001864 | — | — |
| Gurjara Pratihara | 1.8 | 0.69 | 1.21% | 000000000860-01-01-0000860[16] | — | — |
| Sibir Khanate | 1.8 | 0.69 | 1.21% | 000000001520-01-01-00001520[16] | — | — |
| Rashtrakuta dynasty | 1.7 | 0.66 | 1.41% | 000000000805-01-01-0000805[citation needed] | — | — |
| Buyid Sultanate | 1.6 | 0.62 | 1.07% | 000000000980-01-01-0000980[8][16] | — | — |
| Mamluk Sultanate | 1.6 | 0.62 | 1.07% | 000000001228-01-01-00001228[16] | — | — |
| Indo-Parthian Kingdom | 1.5 | 0.58 | 1.01% | 000000000050-01-01-000050[31] | — | — |
| Wu Dynasty | 1.5 | 0.58 | 1.01% | 000000000221-01-01-0000221[31] | — | — |
| Northern Zhou Dynasty | 1.5 | 0.58 | 1.01% | 000000000577-01-01-0000577[31] | — | — |
| Nanda Dynasty | 1.5 | 0.58 | 1.01% | -999999999650-01-01-0000350 BC or 000000000321-01-01-0000321[31][56] | — | — |
| Indo-Scythian Kingdom | 1.5 | 0.58 | 1.01% | -999999999900-01-01-0000100 BC[34] | — | — |
| Tulunids Emirate | 1.5 | 0.58 | 1.01% | 000000000900-01-01-0000900[31] | — | — |
| Idrisid dynasty, Morocco | 1.5 | 0.58 | 1.01% | 000000000828-01-01-0000828[8] | — | — |
| Sur Empire | 1.5 | 0.58 | 1.01% | 000000001545-01-01-00001545[8][16] | — | — |
| Neo-Assyrian Empire | 1.4 | 0.54 | 0.940% | -999999999330-01-01-0000670 BC[8][34] | — | — |
| Songhai Empire | 1.4 | 0.54 | 0.940% | 000000001500-01-01-00001500[57] | — | — |
| Zand dynasty | 1.4 | 0.54 | 0.940% | 000000001750-01-01-00001750 | — | — |
| Empire of Harsha | 1.35 | 0.52 | 0.906% | 000000000625-01-01-0000625 or 000000000648-01-01-0000648[8][16] | — | — |
| Liang Dynasty | 1.3 | 0.50 | 0.873% | 000000000502-01-01-0000502 or 000000000549-01-01-0000549[8][31] | — | — |
| Western Wei Dynasty | 1.3 | 0.50 | 0.873% | 000000000557-01-01-0000557[31] | — | — |
| Later Liang | 1.3 | 0.50 | 0.873% | 000000000923-01-01-0000923[16] | — | — |
| Later Tang | 1.3 | 0.50 | 0.873% | 000000000923-01-01-0000923[16] | — | — |
| Taungoo Dynasty | 1.3 | 0.50 | 0.873% | 000000001581-01-01-00001581[58] | 3.0 | 0.60% (3.0 million out of 500 million[11] in 16th Century) |
| Mali Empire | 1.29 | 0.50 | 0.866% | 000000001312-01-01-00001312[59] | — | 10.00% (45.0 million out of 450 million[60] in the mid-15th century) |
| Siam Empire | 1.29 | 0.50 | 0.866% | 000000001782-01-01-00001782[citation needed] | — | — |
| Shang Dynasty | 1.25 | 0.48 | 0.839% | -999999998878-01-01-00001122 BC[8][34] | — | — |
| Western Zhou Dynasty | 1.25 | 0.48 | 0.839% | -999999998878-01-01-00001122 BC[34] | — | — |
| Aksumite Empire | 1.25 | 0.48 | 0.839% | 000000000350-01-01-0000350[8] | — | — |
| Khmer Empire | 1.2 | 0.46 | 0.806% | 000000001150-01-01-00001150[8][16] | 4.0 in 1150 | 1.333% |
| Carolingian Dynasty, Francia | 1.2 | 0.46 | 0.806% | 000000000814-01-01-0000814[8][16] | — | — |
| Srivijaya Empire | 1.2 | 0.46 | 0.806% | 000000001200-01-01-00001200[8] | — | — |
| Shunga Empire | 1.2 | 0.46 | 0.806% | -999999999850-01-01-0000150 BC[8] | — | — |
| Kingdom of Kush | 1.2 | 0.46 | 0.806% | -999999999300-01-01-0000700 BC[8] | — | — |
| Chalukya Dynasty | 1.1 | 0.42 | 0.739% | 000000000636-01-01-0000636[citation needed] | — | — |
| Swedish Empire | 1.1 | 0.42 | 0.739% | 000000001658-01-01-00001658[citation needed] | — | — |
| Lodhi Dynasty | 1.1 | 0.42 | 0.739% | 000000001517-01-01-00001517[citation needed] | — | — |
| Polish-Lithuanian Empire | 1.0[61] | 0.39 | 0.671% | 000000001619-01-01-00001619[62] | ca. 12.0 (in 1619) | 2.07% to 02.41% (avg. 02.2%)[63] |
| Eighteenth dynasty of Egypt | 1.0 | 0.39 | 0.671% | -999999998550-01-01-00001450 BC[34] | — | — |
| New Kingdom of Egypt | 1.0 | 0.39 | 0.671% | -999999998700-01-01-00001300 BC[8][34] | — | — |
| Ptolemaic Dynasty | 1.0 | 0.39 | 0.671% | -999999999699-01-01-0000301 BC[34] | — | — |
| Eastern Wei Dynasty | 1.0 | 0.39 | 0.671% | 000000000550-01-01-0000550[31] | — | — |
| Northern Qi Dynasty | 1.0 | 0.39 | 0.671% | 000000000550-01-01-0000550[31] | — | — |
| Tahirid dynasty | 1.0 | 0.39 | 0.671% | 000000000800-01-01-0000800[16] | — | — |
| Kalachuri Dynasty | 1.0 | 0.39 | 0.671% | 000000001050-01-01-00001050[8][16] | — | — |
| Holy Roman Empire | 1.0 | 0.39 | 0.671% | 000000001050-01-01-00001050[16] | 5.0 (in 1200) | — |
| Western Xia Dynasty | 1.0 | 0.39 | 0.671% | 000000001100-01-01-00001100[8] | — | — |
| Western Chalukya Empire | 1.0 | 0.39 | 0.671% | 000000001121-01-01-00001121[citation needed] | — | — |
| Avar Khaganate | 1.0 | 0.39 | 0.671% | 000000000600-01-01-0000600[31] | — | — |
| Kanem Empire | 1.0 | 0.39 | 0.671% | 000000001200-01-01-00001200[16] | — | — |
| Bruneian Empire | 0.95 | 0.37 | 0.653% | 000000001524-01-01-00001524[8][34] | — | — |
| Maha-Meghavahana Dynasty | 0.9 | 0.35 | 0.604% | -999999999990-01-01-000010 BC[34] | — | — |
| Konbaung Dynasty, Burma | 0.9 | 0.35 | 0.604% | 000000001800-01-01-00001800[citation needed] | — | — |
| Volga Bulgars Khanate | 0.9 | 0.35 | 0.604% | 000000001100-01-01-00001100[8][16] | — | — |
| Grand Duchy of Lithuania | 0.85 | 0.32 | 0.570% | 000000001490-01-01-00001490 | 4.25 | — |
| First Bulgarian Empire | 0.8 | 0.31 | 0.541% | 000000000927-01-01-0000927[64] | — | — |
| Akkadian Empire | 0.8 | 0.31 | 0.537% | -999999997750-01-01-00002250 BC[34] | — | — |
| Later Jin | 0.8 | 0.31 | 0.537% | 000000000936-01-01-0000936[16] | — | — |
| Ghana Empire | 0.8 | 0.31 | 0.537% | 000000001067-01-01-00001067[31] | — | — |
| Pagan Kingdom | 0.8 | 0.31 | 0.537% | 000000001200-01-01-00001200[16] | — | — |
| Western Satraps Dynasty | 0.8 | 0.31 | 0.537% | 000000000100-01-01-0000100[31] | — | — |
| Himyarite Kingdom | 0.8 | 0.31 | 0.537% | 000000000400-01-01-0000400[34] | — | — |
| Balhae Kingdom | 0.8 | 0.31 | 0.537% | 000000000830-01-01-0000830[8] | — | — |
| Khanate of Kazan | 0.7 | 0.27 | 0.470% | 000000001540-01-01-00001540[16] | — | — |
| Merovingian Dynasty, Francia | 0.7 | 0.27 | 0.470% | 000000000558-01-01-0000558[16] | — | — |
| Shu Dynasty | 0.7 | 0.27 | 0.470% | 000000000221-01-01-0000221[31] | — | — |
| Yadava Gauli Kingdom | 0.7 | 0.27 | 0.470% | 000000001250-01-01-00001250[16] | — | — |
| Paramara Dynasty | 0.7 | 0.27 | 0.470% | 000000001050-01-01-00001050[31] | — | — |
| Kingdom of Dali | 0.7 | 0.27 | 0.470% | 000000001200-01-01-00001200[citation needed] | — | — |
| Vijayanagara Empire | 0.7 | 0.27 | 0.470% | 000000001529-01-01-00001529[citation needed] | — | 5.00% (25.0 million out of 500 million[11] in the 16th century) |
| Kingdom of Nanzhao | 0.7 | 0.27 | 0.470% | 000000000830-01-01-0000830[16] | — | — |
| Austro-Hungarian Empire | 0.68 | 0.26 | 0.454% | 000000001867-01-01-00001867–000000001918-01-01-00001918 | 52.8 in 1914 | 2.90% (51.3 million out of 1.753 billion in 1910) |
| Fifteenth dynasty of Egypt | 0.65 | 0.25 | 0.436% | -999999998350-01-01-00001650 BC[34] | — | — |
| 26th Dynasty of Egypt | 0.65 | 0.25 | 0.436% | -999999999450-01-01-0000550 BC[34] | — | — |
| Vakataka Kingdom | 0.65 | 0.25 | 0.436% | 000000000450-01-01-0000450[34] | — | — |
| Visigothic Kingdom | 0.6 | 0.23 | 0.403% | 000000000580-01-01-0000580[31] | — | — |
| Caliphate of Córdoba | 0.6 | 0.23 | 0.403% | 000000001000-01-01-00001000[16] | — | — |
| Rai Dynasty | 0.6 | 0.23 | 0.403% | 000000000675-01-01-0000675[31] | — | — |
| Maukhari Kannauj Dynasty]] | 0.6 | 0.23 | 0.403% | 000000000600-01-01-0000600[16] | — | — |
| Bahmani Sultanate | 0.6 | 0.23 | 0.403% | 000000001470-01-01-00001470[16] | — | — |
| Nizams Dynasty | 0.6 | 0.23 | 0.403% | 000000001740-01-01-00001740[citation needed] | — | —|- |
| Nguyễn dynasty | 0.575 | 0.222 | 0.388% | 000000001833-01-01-00001833[citation needed] | — | — |
| Sikh Empire | 0.5609 | 0.22 | 0.377% | 000000001845-01-01-00001845[citation needed] | — | — |
| Middle Kingdom of Egypt | 0.5 | 0.19 | 0.336% | -999999998150-01-01-00001850 BC[34] | — | — |
| Lydian Empire | 0.5 | 0.19 | 0.336% | -999999999415-01-01-0000585 BC[34] | — | — |
| Neo-Babylonian Empire | 0.5 | 0.19 | 0.336% | -999999999438-01-01-0000562 BC[34] | — | — |
| Kosala Dynasty | 0.5 | 0.19 | 0.336% | -999999999457-01-01-0000543 BC[31] | — | — |
| Shishunaga dynasty | 0.5 | 0.19 | 0.336% | -999999999490-01-01-0000510 BC[31] | — | — |
| Chu Dynasty | 0.5 | 0.19 | 0.336% | -999999999650-01-01-0000350 BC[31] | — | — |
| Pandyan Dynasty, Tamizhan kingdom | 0.5 | 0.19 | 0.336% | 000000001251-01-01-00001251[citation needed] | — | — |
| Later Han | 0.5 | 0.19 | 0.336% | 000000000947-01-01-0000947[16] | — | — |
| Kangju Empire | 0.5 | 0.19 | 0.336% | -999999999900-01-01-0000100 BC[31] | — | — |
| Ostrogothic Kingdom | 0.5 | 0.19 | 0.336% | 000000000510-01-01-0000510[16] | — | — |
| Second Bulgarian Empire | 0.48 | 0.18 | 0.32% | 000000001241-01-01-00001241[65] | — | — |
| Goguryeo Kingdom | 0.45 | 0.17 | 0.302% | 000000000476-01-01-0000476[34] | — | — |
| Xia Dynasty | 0.45 | 0.17 | 0.302% | -999999998200-01-01-00001800 BC[34] | — | — |
| Polish Piast State | 0.4 | 0.15 | 0.269% | 000000001003-01-01-00001003[62][66] | ca. 2 (in 1003)[61][67] | 0.58% to 0.79% (avg. 0.7%)[63] |
| Crimean Khanate | 0.4 | 0.15 | 0.269% | 000000001500-01-01-00001500[16] | — | — |
| Armenian Kingdom | 0.4 | 0.15 | 0.269% | -999999999811-01-01-0000189 BC[31] | — | 4.0% (10.9 million out of 272 million in 69 BCE)[63] |
| Old Kingdom of Egypt | 0.4 | 0.15 | 0.269% | -999999997600-01-01-00002400 BC[34] | — | — |
| Middle Kingdom of Assyria | 0.4 | 0.15 | 0.269% | -999999998920-01-01-00001080 BC[34] | — | — |
| Latin Empire | 0.35 | 0.14 | 0.235% | 000000001204-01-01-00001204[31] | — | — |
| Mitanni Empire | 0.3 | 0.12 | 0.201% | -999999998550-01-01-00001450 BC[34] | — | — |
| Carthaginian Empire | 0.3 | 0.12 | 0.201% | -999999999780-01-01-0000220 BC[34] | — | — |
| Greater Nepal (Gurkha Empire) | 0.25 | 0.10 | 0.168% | 000000001768-01-01-00001768–000000002008-01-01-00002008 | 47.643 (in 2008) | 0.8% (47.6 million out of 6.7 billion in 2008) |
| 1st Dynasty, Babylon | 0.25 | 0.10 | 0.168% | -999999998310-01-01-00001690 BC[34] | — | — |
| Serbian Empire | 0.25 | 0.10 | 0.168% | 000000001346-01-01-00001346 | — | — |
| Aztec Empire | 0.22 | 0.08 | 0.148% | 000000001520-01-01-00001520[16] | — | 3.0% (15.0 million out of 500 million in 1500)[63] |
| Middle Elamite | 0.2 | 0.08 | 0.134% | -999999998840-01-01-00001160 BC[34] | — | — |
| 2nd Dynasty, Isin | 0.2 | 0.08 | 0.134% | -999999998870-01-01-00001130 BC[34] | — | — |
| Urartu, or Kingdom of Ararat or Van | 0.2 | 0.08 | 0.134% | -999999999200-01-01-0000800 BC[34] | — | — |
| Amorian Dynasty, Byzantium | 0.2 | 0.08 | 0.134% | 000000000820-01-01-0000820[34] | — | — |
| Old Kingdom, Assyria | 0.15 | 0.06 | 0.101% | -999999998270-01-01-00001730 BC[34] | — | — |
| Eastern Zhou Dynasty | 0.15 | 0.06 | 0.101% | -999999999230-01-01-0000770 BC[34] | — | — |
지도
고대 제국
-
기원전 480년의 아케메네스 제국의 최대 범위.
-
마케도니아 제국의 최대 범위.
-
기원전 265년의 마우리아 왕조.
-
기원전 210년의 진나라.
-
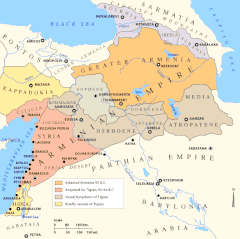
기원전 83년 ~ 기원전 69년 티그라네스 2세 시기의 아르메니아 왕국.
-
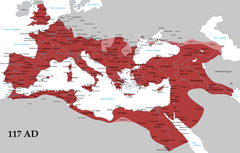
로마 제국의 117년의 전성기.


중세 제국


근대 제국
-
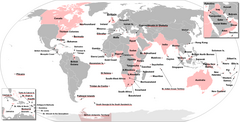
과거 대영 제국의 일부였던 식민지.
-
러시아 제국의 최대 범위.
-
스페인 제국의 시대착오 지도.
-
네덜란드 제국의 시대착오 지도.
-
-
프랑스 제국이 영향력을 가지고 있던 세력 범위.
-
-
-
포르투갈 제국의 시대착오 지도.
-
-
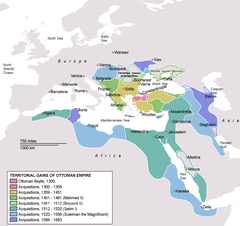
일본 제국의 최대 범위.
-


경제에 따른 거대 제국
아래 목록의 GDP 추계값은 거의 18세기에서 20세기의 근대 제국을 보여준다. 전체 달러액은 1990년 미국 달러다.
GDP 크기
대영 제국 – $918.7 billion (1938)[3]
나치 독일 – $375.6 billion (1938)[3]
일본 제국 – $260.7 billion (1938)[3]
러시아 제국 – $257.7 billion (1917)[11]
청나라 – $241.3 billion (1912년 붕괴 직전에 이미 GDP는 감소)[11]
프랑스 제국 – $234.1 billion (1938)[3]
이탈리아 제국 – $143.4 billion (1938)[3]
아프샤르 왕조 – $119.85 billion (1740)[11]
오스트리아-헝가리 제국 – $100.5 billion (1918)[68]
무굴 제국 – $90.8 billion (1700년에 GDP 감소)[11]
- [[파일:{{{국기그림-1648}}}|22x20px|border |네덜란드]] 네덜란드 제국 – $60 billion (1900)
오스만 제국 – $26.4 billion (1923)[69]
브라질 제국 – $13.6 billion (1889)[68]
포르투갈 제국 – $12.6 billion (1913)[68]
더보기
- List of empires
- List of largest empires that existed in India
- List of Bronze Age States
- List of Classical Age States
- List of Iron Age States
- List of Late Antiquity Age States
- List of states during the Middle Ages
- Historical powers
- List of historical countries and empires spanning more than one continent
- List of countries by area
- List of countries by GDP
- List of countries by population
- List of extinct states
- List of political and geographic subdivisions by total area
- European empires
- African empires
- The World Economy: Historical Statistics
Notes and references
- ↑ Ferguson, p. 15.: "At its maximum extent between the world wars the British Empire covered more than 13 million square miles, approximately 23 percent of the world's land surface."
- ↑ Johnston, Steve, Tea Party Culture War: A Clash of Worldviews, p90, "By 1922, the British Empire presided over 458 million people—one-quarter of the world's population—and comprised more than 13 million square miles."
- ↑ 가 나 다 라 마 바 사 아 Harrison (1998, pp. 3,7).
- ↑ Smil, Vaclav (2010년 1월 29일). 《Why America Is Not a New Rome》. MIT Press. 62쪽. ISBN 9780262288293. 2014년 10월 30일에 확인함.
- ↑ Turner, Tracey (2013년 10월 3일). 《What's the Difference Between Snot and Bogeys?》. Scholastic UK. ISBN 9781407138121. 2014년 10월 30일에 확인함.
- ↑ Finlay.
- ↑ Vandepeer, Matt. “Retrospect Empire” (PDF). The Suttonian. 2014년 10월 30일에 확인함.
- ↑ 가 나 다 라 마 바 사 아 자 차 카 타 파 하 거 너 더 러 머 버 서 어 저 처 커 터 퍼 허 고 노 도 로 모 보 소 오 조 초 코 토 포 호 구 누 두 루 무 부 수 우 주 추 쿠 투 푸 후 Jonathan M. Adams, Thomas D. Hall and Peter Turchin (2006). “East-West Orientation of Historical Empires” (PDF). 《Journal of World-Systems Research》 (University of Connecticut). 12 (no. 2): 219–229.
- ↑ The combined population of China and Korea in the 13th century was 83 in Biraben (2003[page needed]).
- ↑ Biraben, Jean-Noel; Biraben, Jean-Noel (January 1979). “Essai sur l'evolution du nombre des hommes”. 《Population (French Edition)》 (Institut national d'études démographiques) 34 (1): 13–25. doi:10.2307/1531855.
- ↑ 가 나 다 라 마 바 사 아 자 차 카 타 파 하 거 너 더 러 머 버 서 Maddison, op cit.
- ↑ “The Largest Historical Empires”. 2014년 9월 30일에 확인함.
- ↑ http://www.johndclare.net/Empire/images/The%20British%20Empire.ppt
- ↑ http://my.raex.com/~obsidian/earthrul.html
- ↑ Blankinship, Khalid Yahya (1994), 《The End of the Jihad State, the Reign of Hisham Ibn 'Abd-al Malik and the collapse of the Umayyads》, State University of New York Press, 37쪽, ISBN 0-7914-1827-8
- ↑ 가 나 다 라 마 바 사 아 자 차 카 타 파 하 거 너 더 러 머 버 서 어 저 처 커 터 퍼 허 고 노 도 로 모 보 소 오 조 초 코 토 포 호 구 누 두 루 무 부 수 우 주 추 쿠 투 푸 후 그 느 드 르 므 브 스 으 Rein Taagepera (September 1997). “Expansion and Contraction Patterns of Large Polities: Context for Russia”. 《International Studies Quarterly》 41 (3): 475–504. doi:10.1111/0020-8833.00053.
- ↑ 가 나 다 라 마 바 사 (a) John D. Durand, 1960, "The Population Statistics of China, A.D. 2–1953", Population Studies Vol. 13 (No. 3), 209–256. (b) John D. Durand, 1974, "Historical Estimates of World Population: An Evaluation", University of Pennsylvania, Population Center, Analytical and Technical Reports, Number 10.
- ↑ Recorded number of persons and households in 1290 are 58,834,711 and 13,196,206, respectively (History of Yuan), while recorded peak number of persons and households are 59,848,964 and 13,430,322 in 1291, respectively (History of Yuan).
- ↑ Recorded number of persons in 1851 is 432,164,047 according to Draft History of Qing.
- ↑ 가 나 다 Gordon (2005)
- ↑ 가 나 McEvedy and Jones (1978).
- ↑ While estimates for the Achaemenid Empire range from 10–80+ million, most prefer 40–50 million.
- ↑ Yarshater (1996, p. 47)
- ↑ IBGE Dados Históricos dos Censos
- ↑ Rashidun Caliphate
- ↑ Larousse Encyclopedia
- ↑ Morris, Ian. 2009.
- ↑ Jean-Noël Biraben, "The History of the Human Population From the First Beginnings to the Present" in Demography: Analysis and Synthesis: A Treatise in Population (Eds: Graziella Caselli, Jacques Vallin, Guillaume J. Wunsch), Vol.
- ↑ Recorded number of persons and households in 1393 are 60,545,812 and 10,652,870, respectively (Ming Hui Dian), while recorded peak number of persons and households are 66,598,337 and 11,415,829 in 1403, respectively (Book of Ming).
- ↑ Turchin, Peter; Adams, Jonathan M.; Hall, Thomas D (December 2006). “East-West Orientation of Historical Empires” (PDF). 《Journal of world-systems research》 12 (2): 219–229. ISSN 1076-156X. 2010년 8월 12일에 확인함.
- ↑ 가 나 다 라 마 바 사 아 자 차 카 타 파 하 거 너 더 러 머 버 서 어 저 처 커 터 퍼 허 고 노 도 로 모 보 소 오 조 초 코 토 포 호 구 누 두 루 무 Rein Taagepera "Size and Duration of Empires: Growth-Decline Curves, 600 B.C. to 600 A.D.", Social Science History Vol. 3, 115–138 (1979).
- ↑ Recorded number of persons and households in AD 2 are 58,594,978 and 12,233,062, respectively (Book of Han).
- ↑ Turchin, Peter; Adams, Jonathan M.; Hall, Thomas D (December 2006). “East-West Orientation of Historical Empires” (PDF). 《Journal of world-systems research》 12 (2): 219–229. ISSN 1076-156X. 2010년 8월 12일에 확인함.
- ↑ 가 나 다 라 마 바 사 아 자 차 카 타 파 하 거 너 더 러 머 버 서 어 저 처 커 터 퍼 허 고 노 도 로 모 보 Rein Taagepera "Size and Duration of Empires Growth-Decline Curves, 3000 to 600 B.C.", Social Science Research Vol. 7, 180–196 (1978).
- ↑ Taagepera, Rein (1979). “Size and Duration of Empires: Growth-Decline Curves, 600 B.C. to 600 A.D”. 《Social Science History》 (Duke University Press) 3 (3/4): 118. doi:10.2307/1170959. JSTOR 1170959.
- ↑ Taagepera, Rein (1979). “Size and Duration of Empires: Growth-Decline Curves, 600 B.C. to 600 A.D.”. 《Social Science History》 (Duke University Press) 3 (3/4): 125. doi:10.2307/1170959. JSTOR 1170959.
- ↑ Mclynn Frank "Marcus Aurelius" p. 4.
- ↑ There are several different estimates for the Roman Empire.
- ↑ Scheidel, Walter; Friesen, Steven J. (Nov. 2009): "The Size of the Economy and the Distribution of Income in the Roman Empire", The Journal of Roman Studies, Vol. 99, pp. 61–91
- ↑ Data from History Database of the Global Environment.
- ↑ Boesche, Roger (2003년 3월 1일). 《The First Great Political Realist: Kautilya and His Arthashastra》. 11쪽. ISBN 9780739106075.
- ↑ Demeny, Paul George; McNicoll, Geoffrey (May 2003). 《Encyclopedia of population》. ISBN 9780028656793.
- ↑ Chandra, Satish. 《Medieval India: From Sultanate To The Mughals》. 202쪽.
- ↑ Colin McEvedy and Richard Jones (1978), "Atlas of World Population History", Facts on File (p. 183, p. 342).
- ↑ Turchin, Peter; Adams, Jonathan M.; Hall, Thomas D (December 2006). “East-West Orientation of Historical Empires” (PDF). 《Journal of world-systems research》 12 (2): 219–229. ISSN 1076-156X. 2010년 8월 12일에 확인함.
- ↑ Claudio Cioffi-Revilla, J. Daniel Rogers, Steven P. Wilcox, & Jai Alterman, "Computing the Steppes: Data Analysis for Agent-Based Modeling of Polities in Inner Asia", Proceedings of the 104th Annual Meeting of the Amer.
- ↑ “History Chola Empire – History Of Ancient, Medieval And Modern India.”. 2014년 9월 30일에 확인함.
- ↑ "The Cholas"" University of Madras"K. A. Nilakanta Sastri
- ↑ http://empires.findthedata.com/q/20/2513/How-large-was-the-Nazi-Germany-at-its-greatest-extent
- ↑ Recorded number of persons and households in 1103 are 45,981,845 and 20,524,065, respectively (Song Huiyao), while recorded peak number of persons and households are 46,734,784 and 20,882,438 in 1109, respectively (Song Huiyao).
- ↑ Recorded number of persons and households in 1195 are 48,490,400 and 7,223,400, respectively (History of Jin).
- ↑ Recorded number of persons and households are 46,019,956 and 8,907,546, respectively, in 606 (Tongdian) or 609 (Book of Sui).
- ↑ Recorded number of persons and households in 1193 are 27,845,085 and 12,302,873, respectively (Wenxian Tongkao), while recorded peak number of persons and households are 28,320,085 and 12,670.801 in 1223, respectively (Wenxian Tongkao).
- ↑ International Encyclopedia of Revolution and Protest, ed.
- ↑ Recorded number of persons and households in 156 are 56,486,856 and 10,677,960 respectively (Book of the Later Han).
- ↑ Rein Taagepera "Size and Duration of Empires: Systematics of Size", Social Science Research Vol. 7, 108–127 (1978).
- ↑ John O. Hunwick: Timbuktu and the Songahy Empire: Al-Sa’di's Ta’rikh Al-sudan Down to 1613 and other Contemporary Documents (Brill, 2003),p. xlix.
- ↑ Victor B Lieberman (2003). 《Strange Parallels: Southeast Asia in Global Context, c. 800–1830, volume 1, Integration on the Mainland》. Cambridge University Press. 4쪽. ISBN 978-0-521-80496-7.
- ↑ Hempstone, page 312
- ↑ Walker, Sheila S., African roots/American cultures: Africa in the creation of the Americas, Published by Rowman & Littlefield, p. 127. (2001)
- ↑ 가 나 Collective work.
- ↑ 가 나 Maps of border changes"[1]"
- ↑ 가 나 다 라 Historical Estimates of World Population U.S. Census Bureau.
- ↑ "Atlas of Europe in the Middle Ages", Ostrovski, Rome, 1998, page 66
- ↑ Kamburova, Violeta (1992). 《Atlas "History of Bulgaria"》. Sofia: Bulgarian Academy of Sciences. 18, 20, 23쪽.
- ↑ State of Boleslaw Chrobry"History of Poland during the Piast dynasty"
- ↑ Population of Poland"pl:Ludnosc Polski"
- ↑ 가 나 다 Broadberry and Harrison (2005).
- ↑ Pamuk (2005[page needed]).