Electoral district of Nicklin
| Nicklin Queensland—Legislative Assembly | |
|---|---|
 Electoral map of Nicklin 2017 | |
| State | Queensland |
| Dates current | 1986–present |
| MP | Marty Hunt |
| Party | Liberal National Party |
| Namesake | Frank Nicklin |
| Electors | 32,123 (2017) |
| Area | 620 km2 (239.4 sq mi) |
| Coordinates | 26°31′S 152°50′E / 26.517°S 152.833°E |
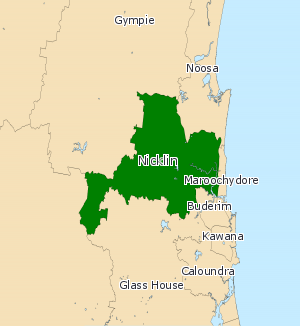
Nicklin is an electoral district of the Legislative Assembly in the Australian state of Queensland. The electorate is centred in the Sunshine Coast hinterland, and stretches north to Black Mountain, south to Palmwoods and Montville, and west to Kenilworth, including Conondale National Park. It includes notable localities such as Nambour, Yandina, Cooroy, Bli Bli, Mapleton and Woombye.[1]
The seat is currently held by Marty Hunt of the Liberal National Party. In 2017 he succeeded independent Peter Wellington, who was first elected at the 1998 election. His first vote in Parliament was to decide who would form government, the election having left the Labor Party one seat short of a majority. Wellington backed the formation of a minority Beattie Labor government.
Members for Nicklin
| Member | Party | Term | |
|---|---|---|---|
| Brian Austin | National | 1986–1989 | |
| Bob King | Liberal | 1989–1990[1] | |
| Neil Turner | National | 1990–1998 | |
| Peter Wellington | Independent | 1998–2017 | |
| Marty Hunt | Liberal National | 2017–present | |
1 Election declared void by the Court of Disputed Returns
Election results
| Party | Candidate | Votes | % | ±% | |
|---|---|---|---|---|---|
| Independent | Peter Wellington | 13,237 | 43.79 | +4.65 | |
| Liberal National | Matt Trace | 9,379 | 31.03 | −4.84 | |
| Labor | Justin Raethel | 4,941 | 16.34 | +8.48 | |
| Greens | Julie Doolan | 2,673 | 8.84 | +1.77 | |
| Total formal votes | 30,230 | 97.78 | −0.49 | ||
| Informal votes | 686 | 2.22 | +0.49 | ||
| Turnout | 30,916 | 90.59 | −0.26 | ||
| Two-candidate-preferred result | |||||
| Independent | Peter Wellington | 18,058 | 64.89 | +10.01 | |
| Liberal National | Matt Trace | 9,770 | 35.11 | −10.01 | |
| Independent hold | Swing | +10.01 | |||
References
External links
- Electorate Profile (Antony Green, ABC)