List of cities in the European Union by population within city limits
This is a list of the largest 100 cities in the European Union ranked according to the population within their city limits. It deals exclusively with the areas within city administrative boundaries as opposed to urban areas or larger urban zones (metropolitan areas), which are generally larger in terms of population than the main city.
As some cities have very narrow city limits and others very wide, the list may not give an accurate view of the comparative magnitude of different places, and the figures in the list should be treated with caution. For example, Paris and Madrid constitute the most populous urban areas in the European Union, but the strict definition of the administrative limits of Paris results in a far lower population shown in the table below.
Cities by population within city limits
Note: The cities are sorted by the column labelled Official population (actual). Cities in bold are capital cities of their respective countries; Brussels (italics) is the capital of both Belgium and the EU.
| Rank | City | State | Official population | Date of census/estimate | Notes | Image |
|---|---|---|---|---|---|---|
| 1 | London[Notes 1] | 8,787,892 | 22 June 2016 | [1] | 
| |
| 2 | Berlin | 3,670,622 | 31 December 2016 | [2] | 
| |
| 3 | Madrid | 3,141,991 | 1 January 2015 | [3] | 
| |
| 4 | Rome | 2,877,215 | 31 December 2016 | [4] | 
| |
| 5 | Paris | 2,244,000 | 1 January 2015 | [5] | 
| |
| 6 | Bucharest | 2,106,144 | 1 January 2016 | [6] | 
| |
| 7 | Vienna | 1,877,836 | 1 July 2017 | [7] | 
| |
| 8 | Hamburg | 1,787,408 | 30 December 2015 | [8] | 
| |
| 9 | Budapest | 1,759,407 | 1 January 2016 | [9] | 
| |
| 10 | Warsaw | 1,753,977 | 31 December 2016 | [10] | 
| |
| 11 | Barcelona | 1,608,746 | 31 December 2016 | [11] | 
| |
| 12 | Munich | 1,542,860 | 31 December 2016 | [12] | 
| |
| 13 | Milan | 1,351,562 | 31 December 2016 | [4] | 
| |
| 14 | Prague | 1,280,508 | 31 December 2015 | [13] | 
| |
| 15 | Sofia | 1,260,120 | 31 December 2015 | [14] | 
| |
| 16 | Brussels[Notes 2] | 1,187,890 | 1 January 2016 | [15] | 
| |
| 17 | Birmingham | 1,111,307 | 30 June 2015 | [16] | 
| |
| 18 | Cologne | 1,060,582 | 31 December 2015 | [17] | 
| |
| 19 | Naples | 970,185 | 31 December 2016 | [4] | 
| |
| 20 | Stockholm | 935,619 | 31 December 2016 | [18] | 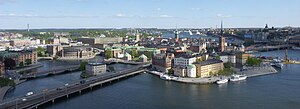
| |
| 21 | Turin | 886,837 | 31 December 2016 | [4] | 
| |
| 22 | Marseille | 852,516 | 31 December 2012 | [19] | 
| |
| 23 | Amsterdam | 848,861 | 31 December 2016 | [20] | 
| |
| 24 | Zagreb | 806,920 | 14 September 2016 | [21] | 
| |
| 25 | Valencia | 790,201 | 1 January 2016 | [3] | 
| |
| 26 | Leeds | 774,060 | 30 June 2015 | [16] | 
| |
| 27 | Kraków | 762,448 | 30 June 2016 | [10] | 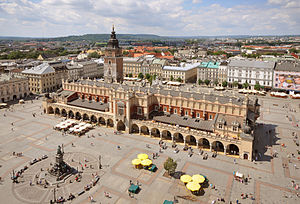
| |
| 28 | Frankfurt | 732,688 | 31 December 2015 | [22] | 
| |
| 29 | Łódź | 698,688 | 30 June 2016 | [10] | 
| |
| 30 | Seville | 693,878 | 1 January 2015 | [3] | 
| |
| 31 | Palermo | 673,735 | 31 December 2016 | [4] | 
| |
| 32 | Zaragoza | 664,953 | 1 January 2015 | [3] | 
| |
| 33 | Athens | 664,046 | 22 July 2011 | [23] | 
| |
| 34 | Riga | 641,007 | 1 July 2015 | [24] | 
| |
| 35 | Rotterdam | 638,221 | 31 December 2016 | [20] | 
| |
| 36 | Wrocław | 637,075 | 30 June 2016 | [10] | 
| |
| 37 | Helsinki | 630,752 | 1 January 2016 | [25] | 
| |
| 38 | Stuttgart | 623,441 | 31 December 2014 | [26] | 
| |
| 39 | Düsseldorf | 612,178 | 31 December 2015 | [17] | 
| |
| 40 | Glasgow | 606,340 | 30 June 2015 | [16] | 
| |
| 41 | Genoa | 583,601 | 31 December 2016 | [4] | 
| |
| 42 | Dortmund | 586,181 | 31 December 2015 | [17] | ||
| 14 | Copenhagen | 1,295,686 | 1 January 2015 | [27] | 
| |
| 44 | Essen | 582,624 | 31 December 2015 | [17] | 
| |
| 45 | Sheffield | 569,737 | 30 June 2015 | [16] | 
| |
| 46 | Málaga | 569,130 | 1 January 2015 | [3] | 
| |
| 47 | Leipzig | 560,472 | 31 December 2015 | [28] | 
| |
| 48 | Bremen | 557,464 | 31 December 2015 | [29] | 
| |
| 49 | Dublin | 553,165 | 24 April 2016 | [30] | 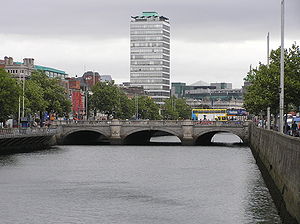
| |
| 50 | Lisbon | 547,631 | 1 January 2011 | [31] | 
| |
| 51 | Dresden | 543,825 | 31 December 2015 | [28] | 
| |
| 52 | Vilnius | 574,221 | 1 March 2017 | [32] | 
| |
| 53 | Poznań | 574,221 | 31 December 2015 | [10] | 
| |
| 54 | Gothenburg | 541,145 | 31 December 2014 | [33] | 
| |
| 55 | Hanover | 532,163 | 31 December 2015 | [34] | 
| |
| 56 | Bradford | 531,176 | 30 June 2015 | [16] | 
| |
| 57 | Manchester | 530,292 | 30 June 2015 | [16] | 
| |
| 58 | The Hague | 524,305 | 31 December 2016 | [20] | 
| |
| 59 | Antwerp | 510,610 | 1 January 2014 | [35] | 
| |
| 60 | Nuremberg | 500,096 | 30 September 2014 | [12] | 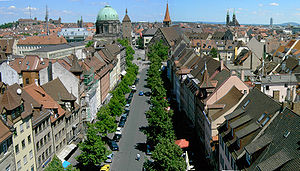
| |
| 61 | Edinburgh | 498,810 | 30 June 2015 | [16] | ||
| 62 | Lyon | 491,268 | 31 December 2011 | [36] | 
| |
| 63 | Duisburg | 491,231 | 31 December 2015 | [17] | ||
| 64 | Liverpool | 478,580 | 30 June 2015 | [16] | 
| |
| 65 | Gdańsk | 462,249 | 31 December 2015 | [10] | 
| |
| 66 | Bristol | 449,328 | 30 June 2015 | [16] | 
| |
| 67 | Toulouse | 447,340 | 31 December 2011 | [37] | 
| |
| 68 | Tallinn | 444,215 | 1 April 2017 | [38] | 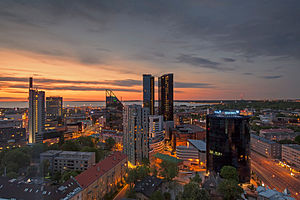
| |
| 69 | Murcia | 439,889 | 1 January 2015 | [3] | 
| |
| 70 | Bratislava | 422,932 | 31 October 2016 | [39] | 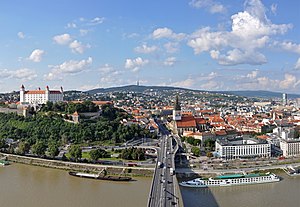
| |
| 71 | Szczecin | 405,657 | 31 December 2015 | [10] | 
| |
| 72 | Palma de Mallorca | 400,578 | 1 January 2015 | [3] | 
| |
| 73 | Bologna | 388,367 | 31 December 2016 | [4] | 
| |
| 74 | Florence | 382,258 | 31 December 2016 | [4] | 
| |
| 75 | Las Palmas | 379,766 | 1 January 2015 | [3] | 
| |
| 76 | Brno | 378,327 | 1 January 2013 | [13] | 
| |
| 77 | Bochum | 364,742 | 31 December 2015 | [17] | 
| |
| 78 | Cardiff | 357,160 | 30 June 2015 | [16] | 
| |
| 79 | Bydgoszcz | 355,645 | 31 December 2015 | [10] | 
| |
| 80 | Wuppertal | 350,046 | 31 December 2015 | [17] | 
| |
| 81 | Coventry | 345,385 | 30 June 2015 | [16] | 
| |
| 82 | Bilbao | 345,141 | 1 January 2015 | [3] | 
| |
| 83 | Nice | 344,064 | 31 December 2011 | [40] | 
| |
| 84 | Utrecht | 343,086 | 31 December 2016 | [20] | ||
| 85 | Leicester | 342,627 | 30 June 2015 | [16] | 
| |
| 86 | Plovdiv | 341,625 | 31 December 2015 | [14] | 
| |
| 87 | Lublin | 340,727 | 31 December 2015 | [10] | ||
| 88 | Belfast | 338,907 | 30 June 2015 | [41] | 
| |
| 89 | Varna | 334,466 | 31 December 2015 | [14] | 
| |
| 90 | Wakefield | 333,759 | 30 June 2015 | [16] | 
| |
| 91 | Bielefeld | 333,090 | 31 December 2015 | [17] | ||
| 92 | Malmö | 331,201 | 30 June 2017 | [18] | 
| |
| 93 | Alicante | 328,648 | 1 January 2015 | [3] | 
| |
| 94 | Córdoba | 327,362 | 1 January 2015 | [3] | 
| |
| 95 | Aarhus | 326,676 | 1 October 2014 | .[42] | 
| |
| 96 | Thessaloniki | 325,182 | 24 May 2011 | [43] | 
| |
| 97 | Cluj-Napoca | 324,576 | 20 October 2011 | [44] | 
| |
| 98 | Bari | 324,198 | 31 December 2016 | [4] | 
| |
| 99 | Timișoara | 319,279 | 20 October 2011 | [44] | 
| |
| 100 | Catania | 313,396 | 31 December 2016 | [4] | 
|
See also
- List of urban areas in the European Union
- List of larger urban zones (metropolitan area)
- List of cities in Europe by population within city limits
Notes
- ^ Refers to Greater London which is composed of the Greater London Authority, 32 borough councils and the City of London
- ^ Refers to Brussels Capital Region
References
- ^ "Population Estimates for UK, England and Wales, Scotland and Northern Ireland". ONS. 22 June 2016. Retrieved 26 June 2017.
- ^ "Statistics Agency Berlin-Brandenburg". Retrieved 10 August 2016.
- ^ a b c d e f g h i j k "Instituto Nacional de Estadística. (National Statistics Institute)". Ine.es. Retrieved 15 August 2016.
- ^ a b c d e f g h i j "Bilancio Demografico della Popolazione Residente per Mese – Dicembre 2016" (in Italian). Istat.it.
- ^ Institut National de la Statistique et des Études Économiques. "Commune : Paris (75056) – Thème : Évolution et structure de la population". Retrieved 24 July 2013.
- ^ "Official data for 2016 census" (PDF) (in Romanian). INSSE. 1 January 2016. Retrieved 19 January 2017.
- ^ "Statistik Austria". Retrieved 1 October 2015.
- ^ "Statistics Agency of Hamburg and Schleswig-Holstein". Retrieved 10 August 2016.
{{cite web}}: Cite has empty unknown parameter:|1=(help) - ^ "Population by type of settlement - annually". Hungarian Central Statistical Office. 11 May 2016. Retrieved 11 May 2016.
- ^ a b c d e f g h i "Warszawa". Retrieved 28 June 2017.
{{cite web}}: Unknown parameter|deadurl=ignored (|url-status=suggested) (help) - ^ "Institut d'Estadística de Catalunya". Retrieved 22 February 2017.
- ^ a b Bayerisches Landesamt für Statistik und Datenverarbeitung. "www.statistik.bayern.de" (in German). Retrieved 5 January 2017.
- ^ a b "Český statistický úřad, k 31.12.2015" (in Czech). Český statistický úřad. Retrieved 31 December 2015.
- ^ a b c [1], National Statistical Institute of Bulgaria 2015
- ^ "Wettelijke bevolking per gemeente op 1 januari 2012". Statbel.fgov.be. Retrieved 24 July 2013.
- ^ a b c d e f g h i j k l m "Population Estimates for UK, England and Wales, Scotland and Northern Ireland". ONS. 23 June 2016. Retrieved 26 June 2016.
- ^ a b c d e f g h "Statistics Agency Nordrhein-Westfalen". It.nrw.de. Retrieved 2 October 2013.
- ^ a b Largest cities of the European Union by population within city limits#cite note-Scb.se-21
- ^ Institut National de la Statistique et des Études Économiques. "Commune : Marseille (13055) – Thème : Évolution et structure de la population". Retrieved 24 July 2013.
- ^ a b c d "Bevolkingsontwikkeling; regio per maand". Statline.cbs.nl. 31 January 2017. Retrieved 31 January 2017.
- ^ "Grad Zagreb Population". Population.City. 14 September 2016. Retrieved 10 June 2017.
- ^ "Statistics Agency Hessen". Statistik-hessen.de. 30 June 2014. Retrieved 2 April 2015.
- ^ "'Πίνακας 1: Προσωρινά αποτελέσματα του Μόνιμου Πληθυσμού της Ελλάδος'" (PDF). National Statistical Service of Greece: Ανακοίνωση προσωρινών αποτελεσμάτων Απογραφής Πληθυσμού 2011, 22 Ιουλίου 2011.
- ^ "Pilsonības un migrācijas lietu pārvalde - Iedzīvotāju reģistra statistika". 1 January 2014. Retrieved 16 February 2014.
- ^ "COS Bevolkingsmonitor januari 2016" (PDF). Retrieved 14 March 2016.
- ^ "Statistics Agency Baden-Wuerttemberg". Statistik.baden-wuerttemberg.de. 28 March 2013. Retrieved 2 October 2013.
- ^ "Danmarks Statistikbank". Statistikbanken.dk. Retrieved 2 October 2013.
- ^ a b Statistics Agency Saxony
- ^ "Statistics Agency Bremen". Statistik-bremen.de. Retrieved 10 August 2016.
- ^ "Population and Actual and Percentage Change 2011 to 2016 by Sex, Province County or City, CensusYear and Statistic". Cso.ie. Retrieved 7 September 2016.
- ^ http://www.ine.pt/scripts/flex_provisorios/Main.html
- ^ osp.stat.gov.lt / Šiuolaikinė Lietuva (1991–dabar)
- ^ http://www4.goteborg.se/prod/G-info/statistik.nsf
- ^ "Statistics Agency Lower Saxony". .nls.niedersachsen.de. Retrieved 22 September 2015.
- ^ "Stad Antwerpen in Cijfers". Stad Antwerpen. Retrieved 18 March 2013.
- ^ Institut National de la Statistique et des Études Économiques. "Commune : Lyon (69123) – Thème : Évolution et structure de la population". Retrieved 7 March 2015.
- ^ Institut National de la Statistique et des Études Économiques. "Commune : Toulouse (31555) – Thème : Évolution et structure de la population". Retrieved 7 March 2015.
- ^ "Number of Tallin residents". Tallinn City Government. Retrieved 24 July 2013.
- ^ "Statistic Bureau of Slovakia".
- ^ Institut National de la Statistique et des Études Économiques. "Commune : Nice (06088) – Thème : Évolution et structure de la population". Retrieved 7 March 2015.
- ^ "2015 Mid-Year Population Estimates for Areas within Northern Ireland". Northern Ireland Statistics and Research Agency. Retrieved 7 September 2016.
- ^ http://www.dst.dk/da/Statistik/emner/kommuner-paa-landkortet.aspx
- ^ "Press Release" (PDF). Archived from the original (PDF) on 13 November 2011. Retrieved 19 February 2013.
{{cite web}}: Unknown parameter|deadurl=ignored (|url-status=suggested) (help) - ^ a b http://www.digi24.ro/Stiri/Regional/Digi24+Timisoara/Stiri/Recensamant+in+Timis+cati+locuitori+are+orasul+sau+comuna